Problem Statement:
To create Report and Dashboard which can track KPIs (sales, revenue, profit, and returns), compare regional performance, analyze product level trends and forecasts, and identify high-value customers.
Github
Tools and Technologies:
- Microsoft Power BI, Microsoft Excel
Summary:
- Imported raw CSV files containing information about transactions, returns, products, customers, and territories in PowerBI.
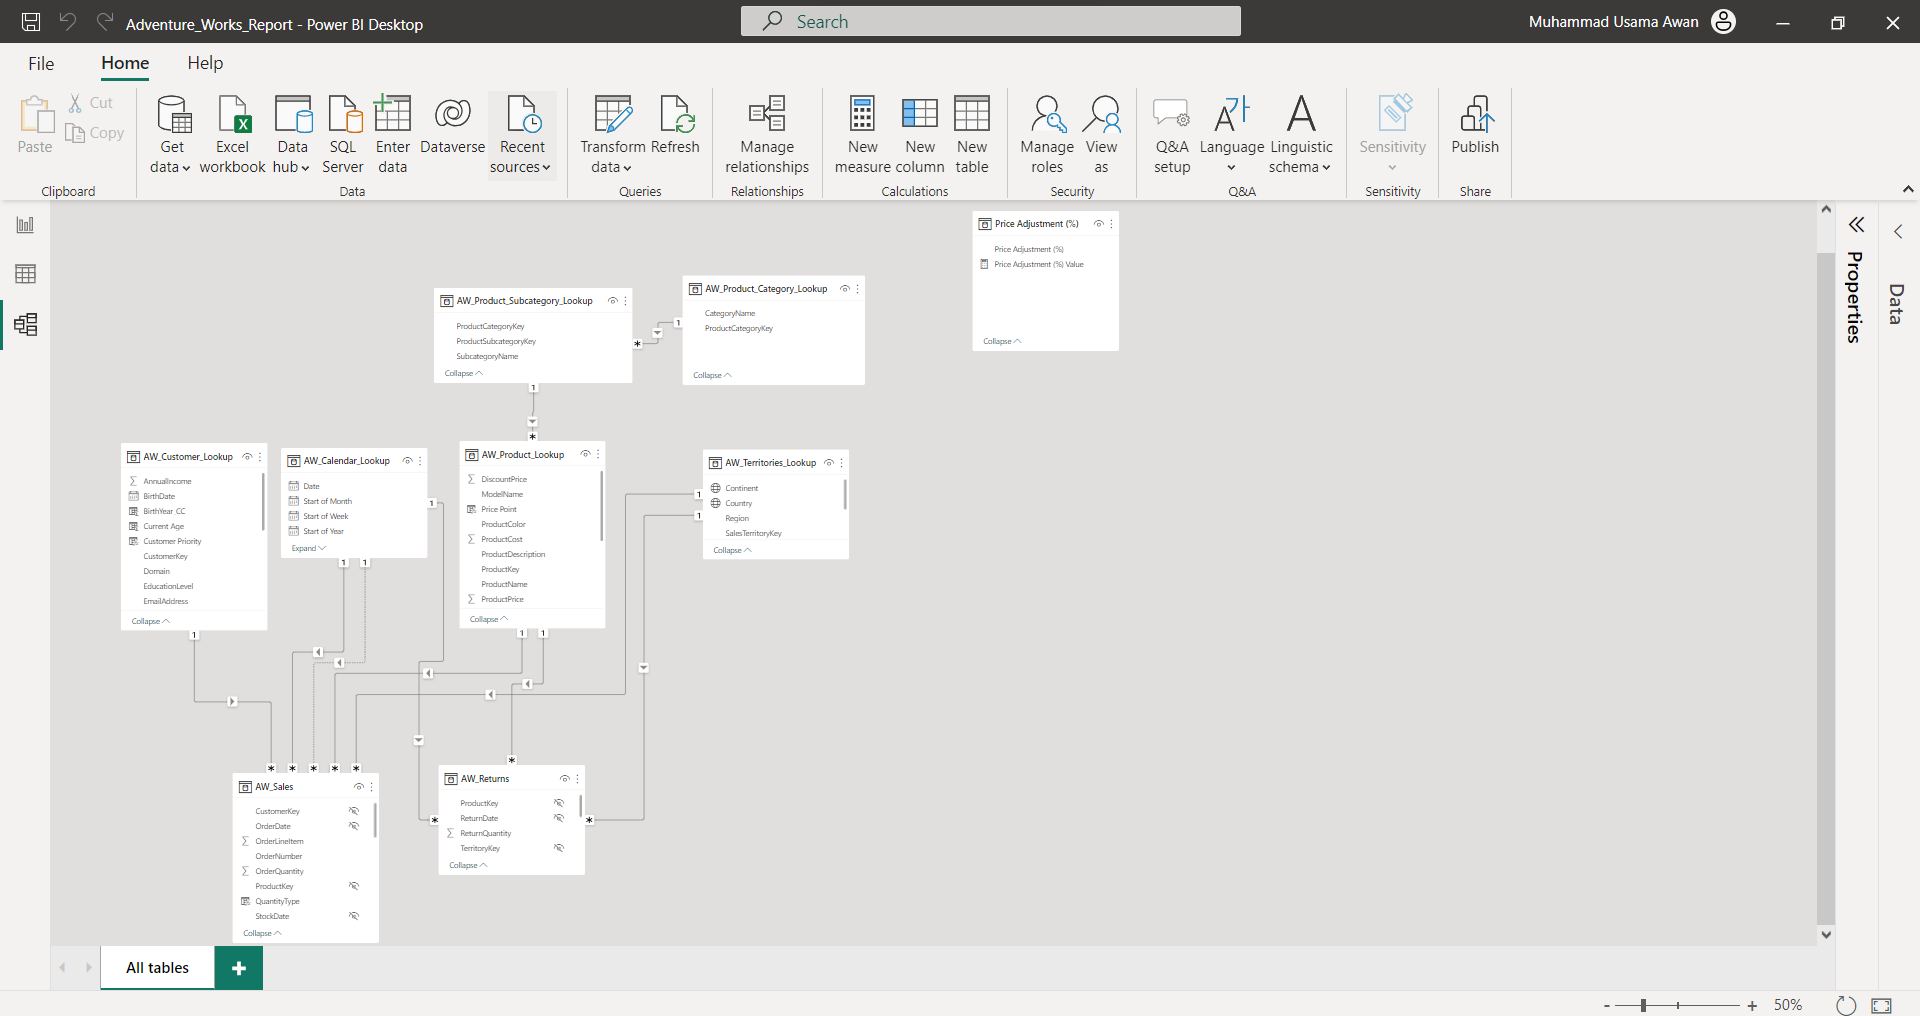
- Connected and transformed the raw data.
- Created new calculated columns and DAX measures.
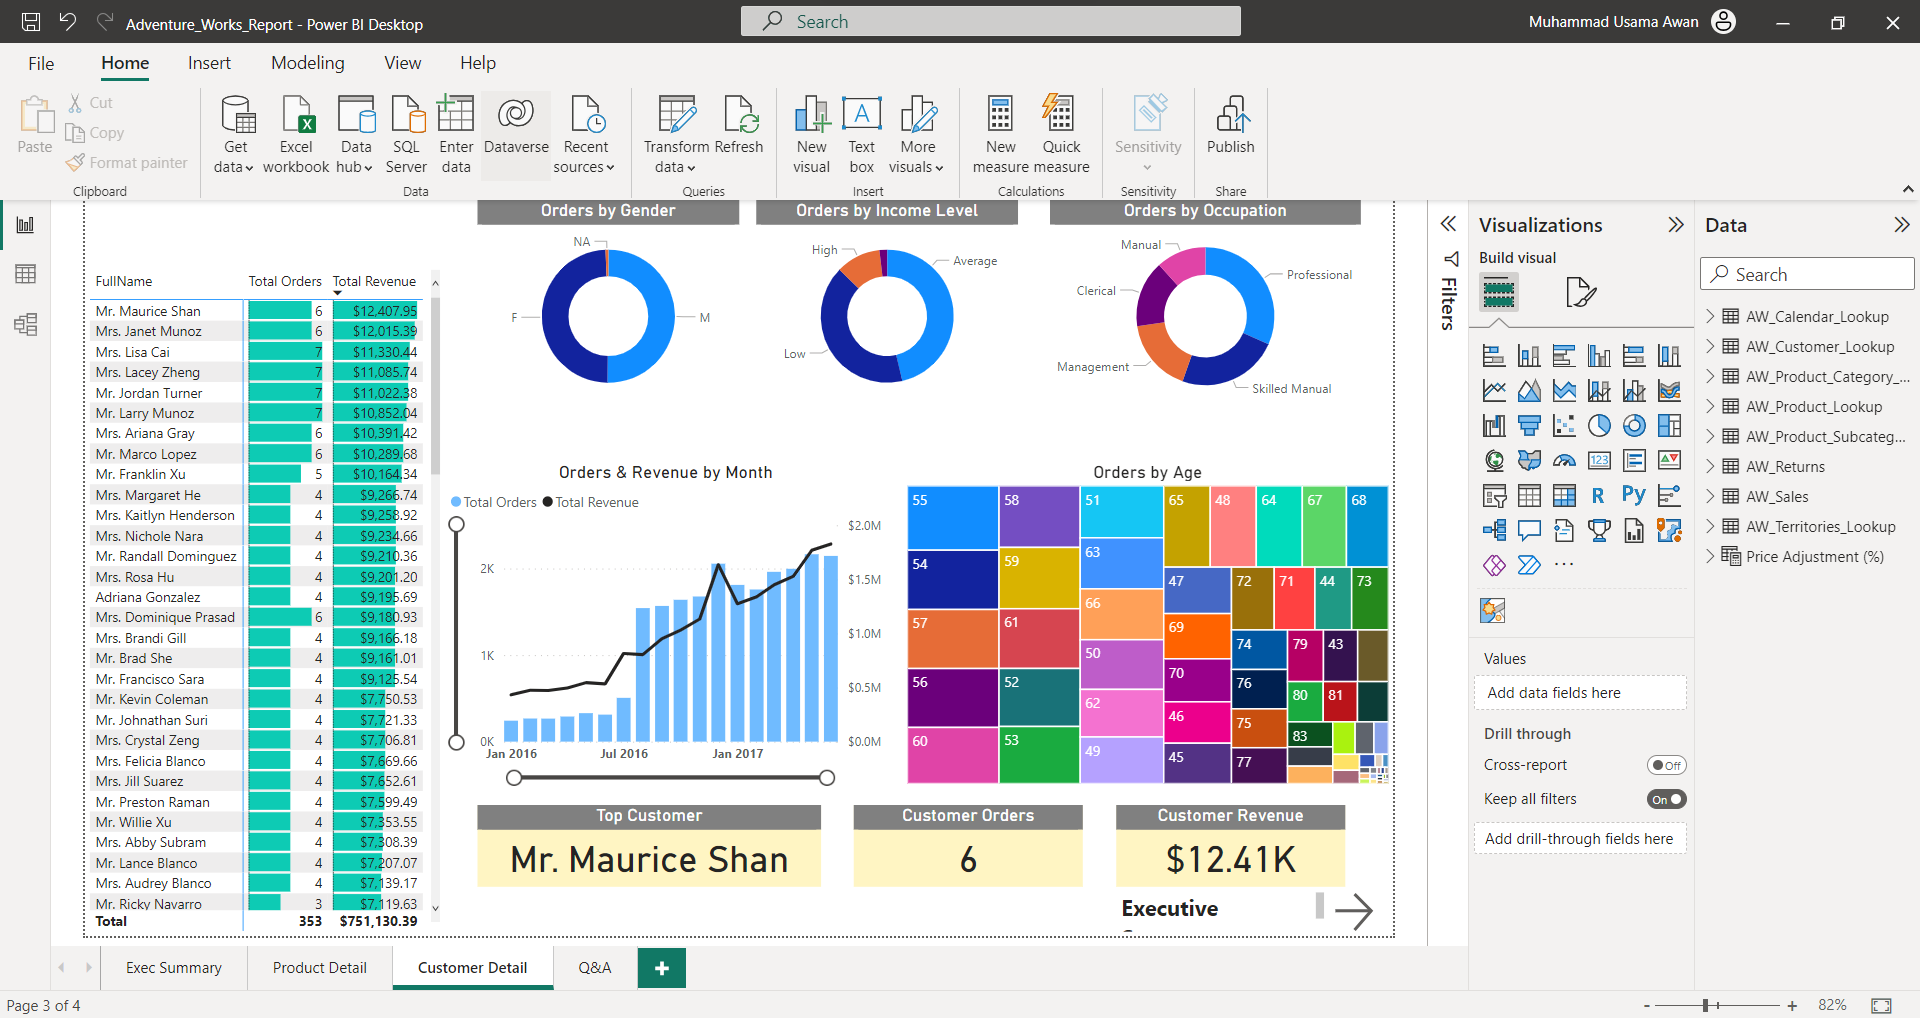
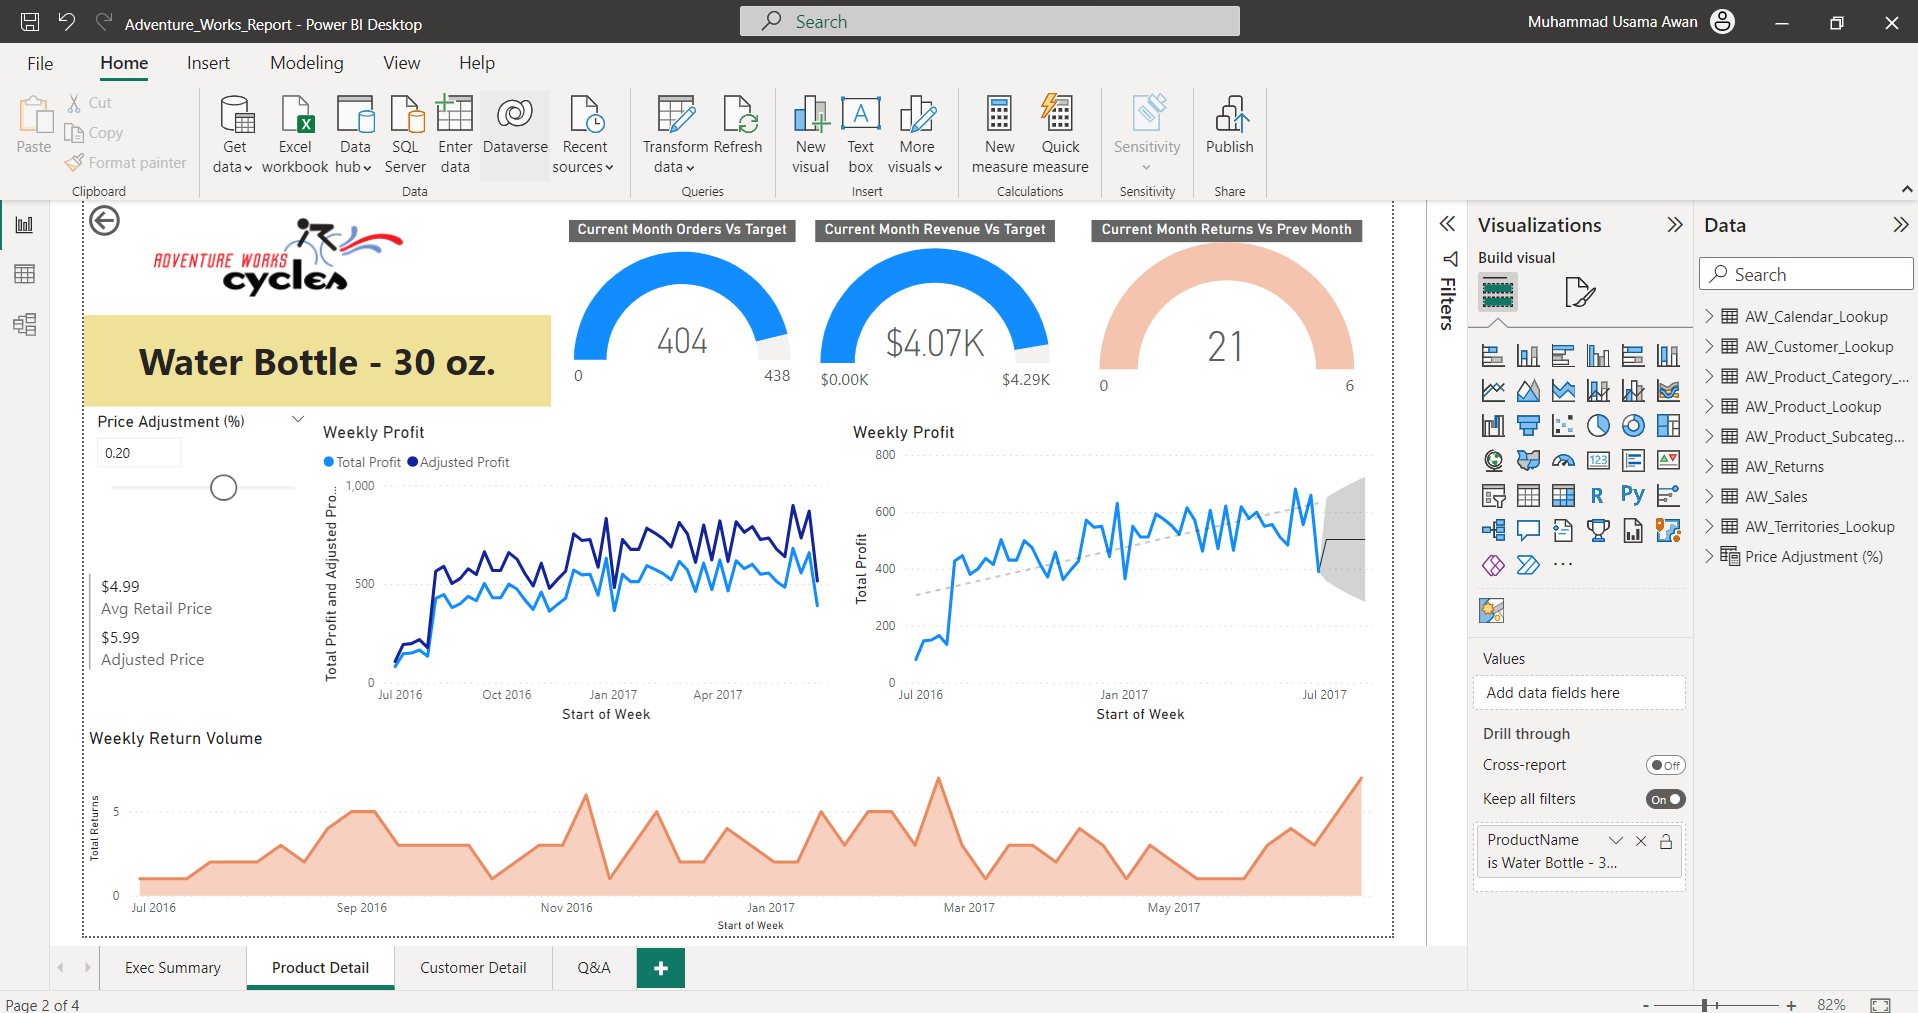
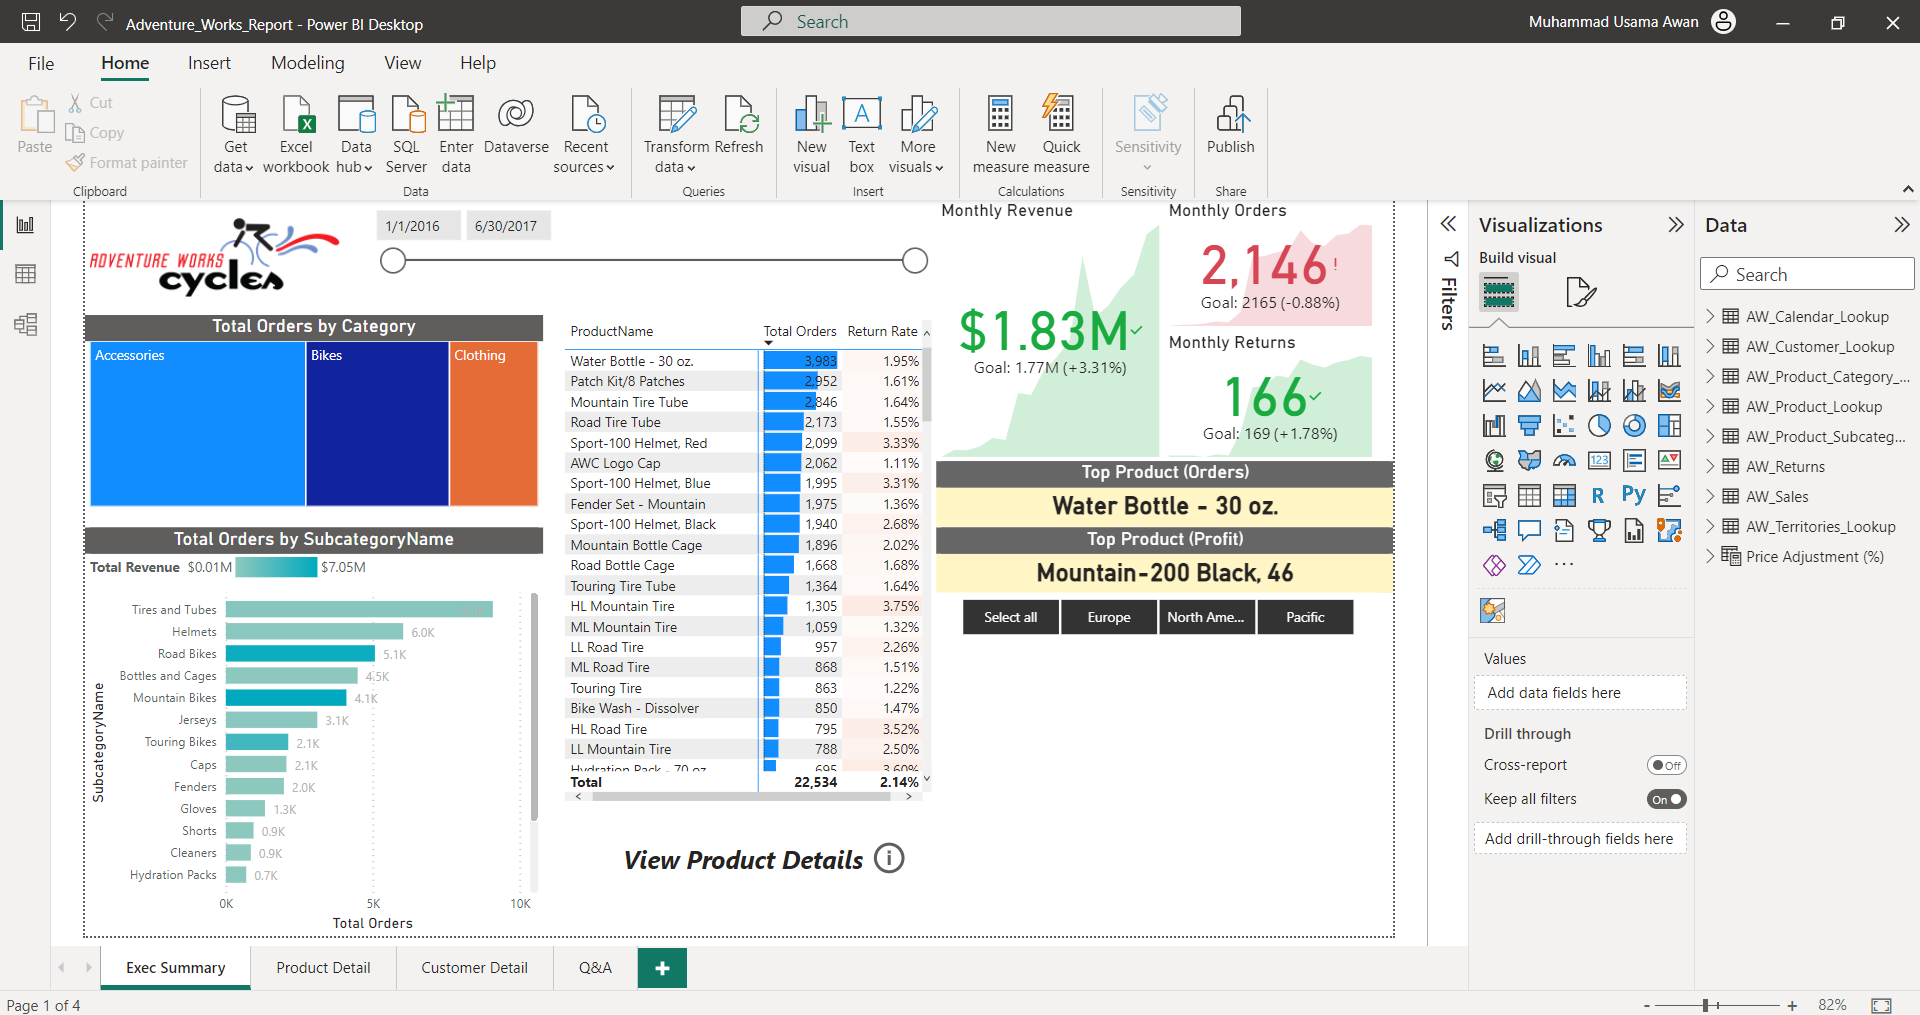
- Designed an interactive report to analyze and visualize the data.