Problem Statement:
The company required a dynamic tool to track and compare daily sales against targets in real time, enabling better visibility into performance and facilitating prompt adjustments to sales strategies. The existing reports could not provide immediate insights into sales growth and regional performance, leading to delayed responses and missed opportunities for optimization.
Tools and Technologies:
- Azure Data Factory, Microsoft Power BI, Azure SQL
Summary:
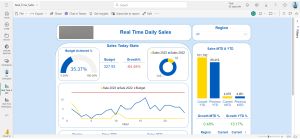
- Developed a Power BI dashboard to monitor daily sales performance in real-time, including budget achievement, sales growth, and comparative analysis across different regions and time periods.
- The dashboard features dynamic visualizations such as gauge charts, line graphs, and bar charts, allowing stakeholders to quickly assess sales trends and make informed decisions.
- Improved sales visibility and enabled the identification of growth opportunities with a 13.17% increase in YTD sales.
