Problem Statement:
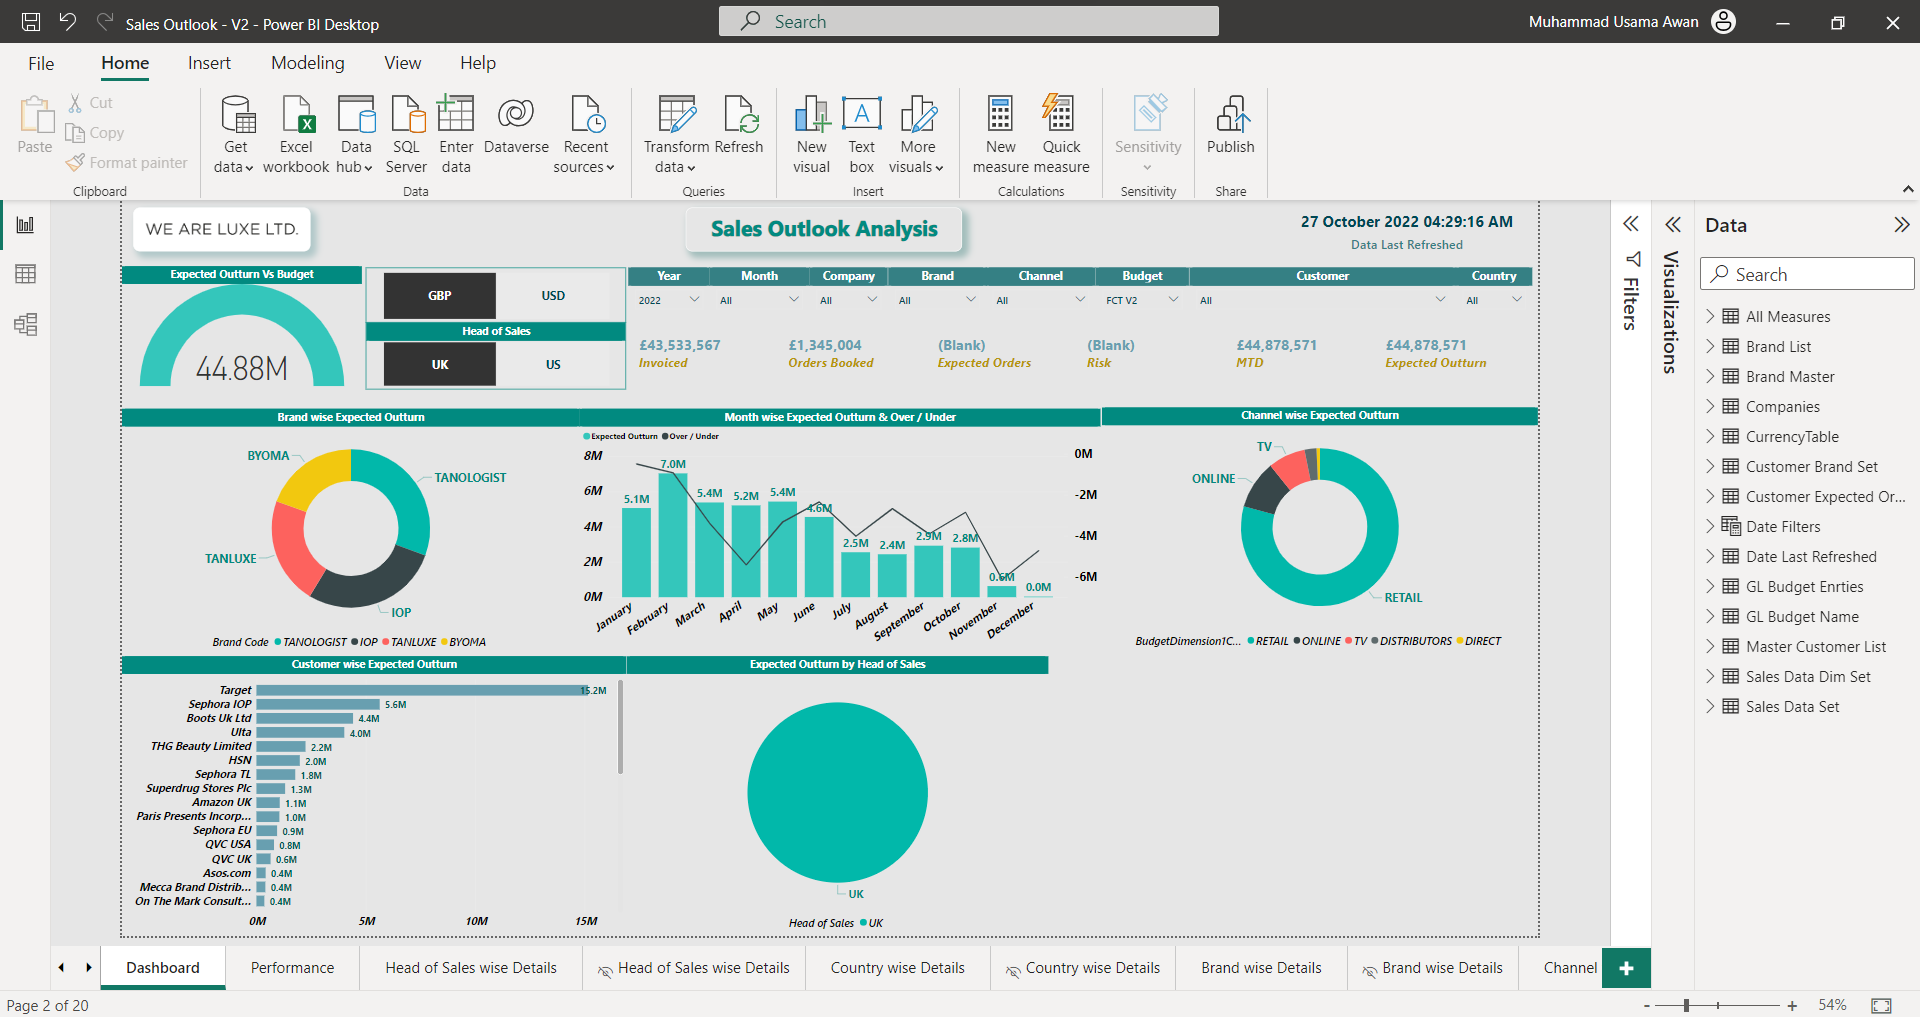
To create a dashboard and reports which includes the calculations split by: Actuals Vs. Forecast, Country-wise, Brand-wise, Channels Wise, Order Wise, Performance-wise, and Margin-wise.
GitHub
Tools and Technologies:
- Microsoft Power BI, Azure Data Factory, SQL Server Management Studio, Business Central, Logic App, Azure SQL, Azure Key vault
Summary:
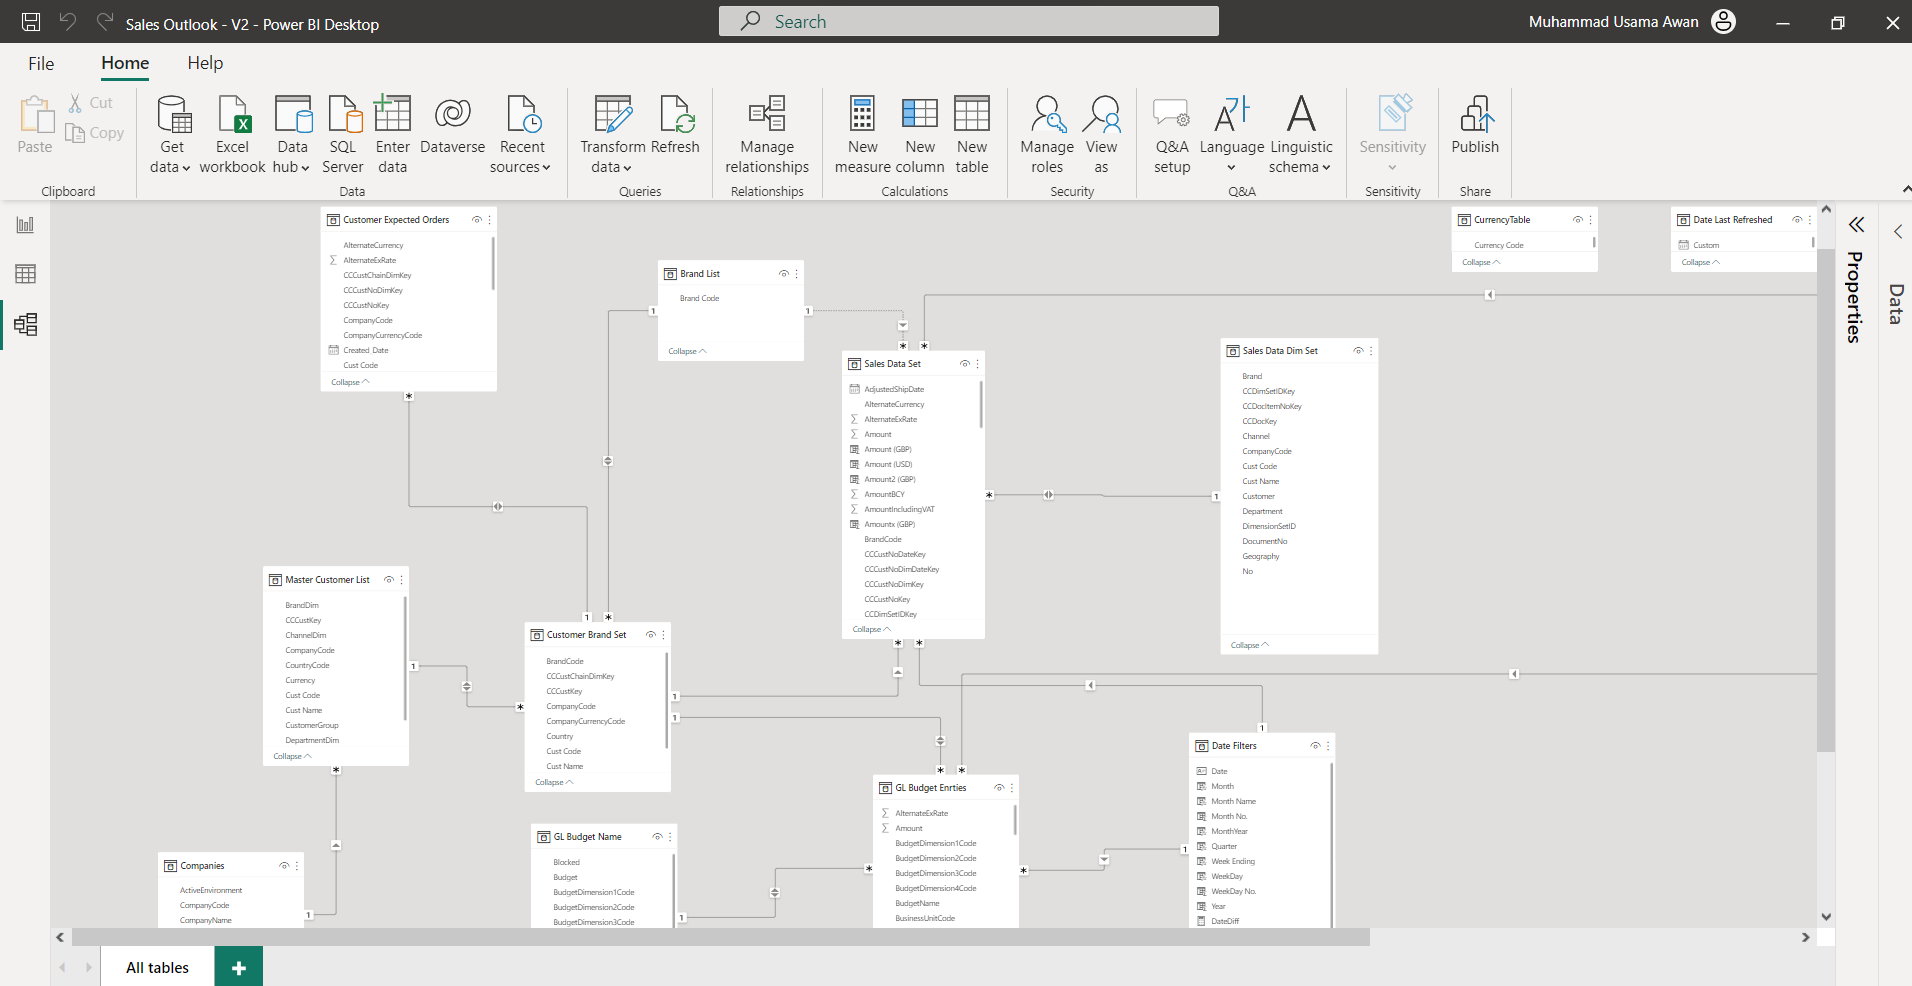
- These reports are based on Business Central. Used the Data warehouse (mentioned in the portfolio) to create these Reports.
- Used SQL views to fetch data from different tables and then imported them into Power BI.
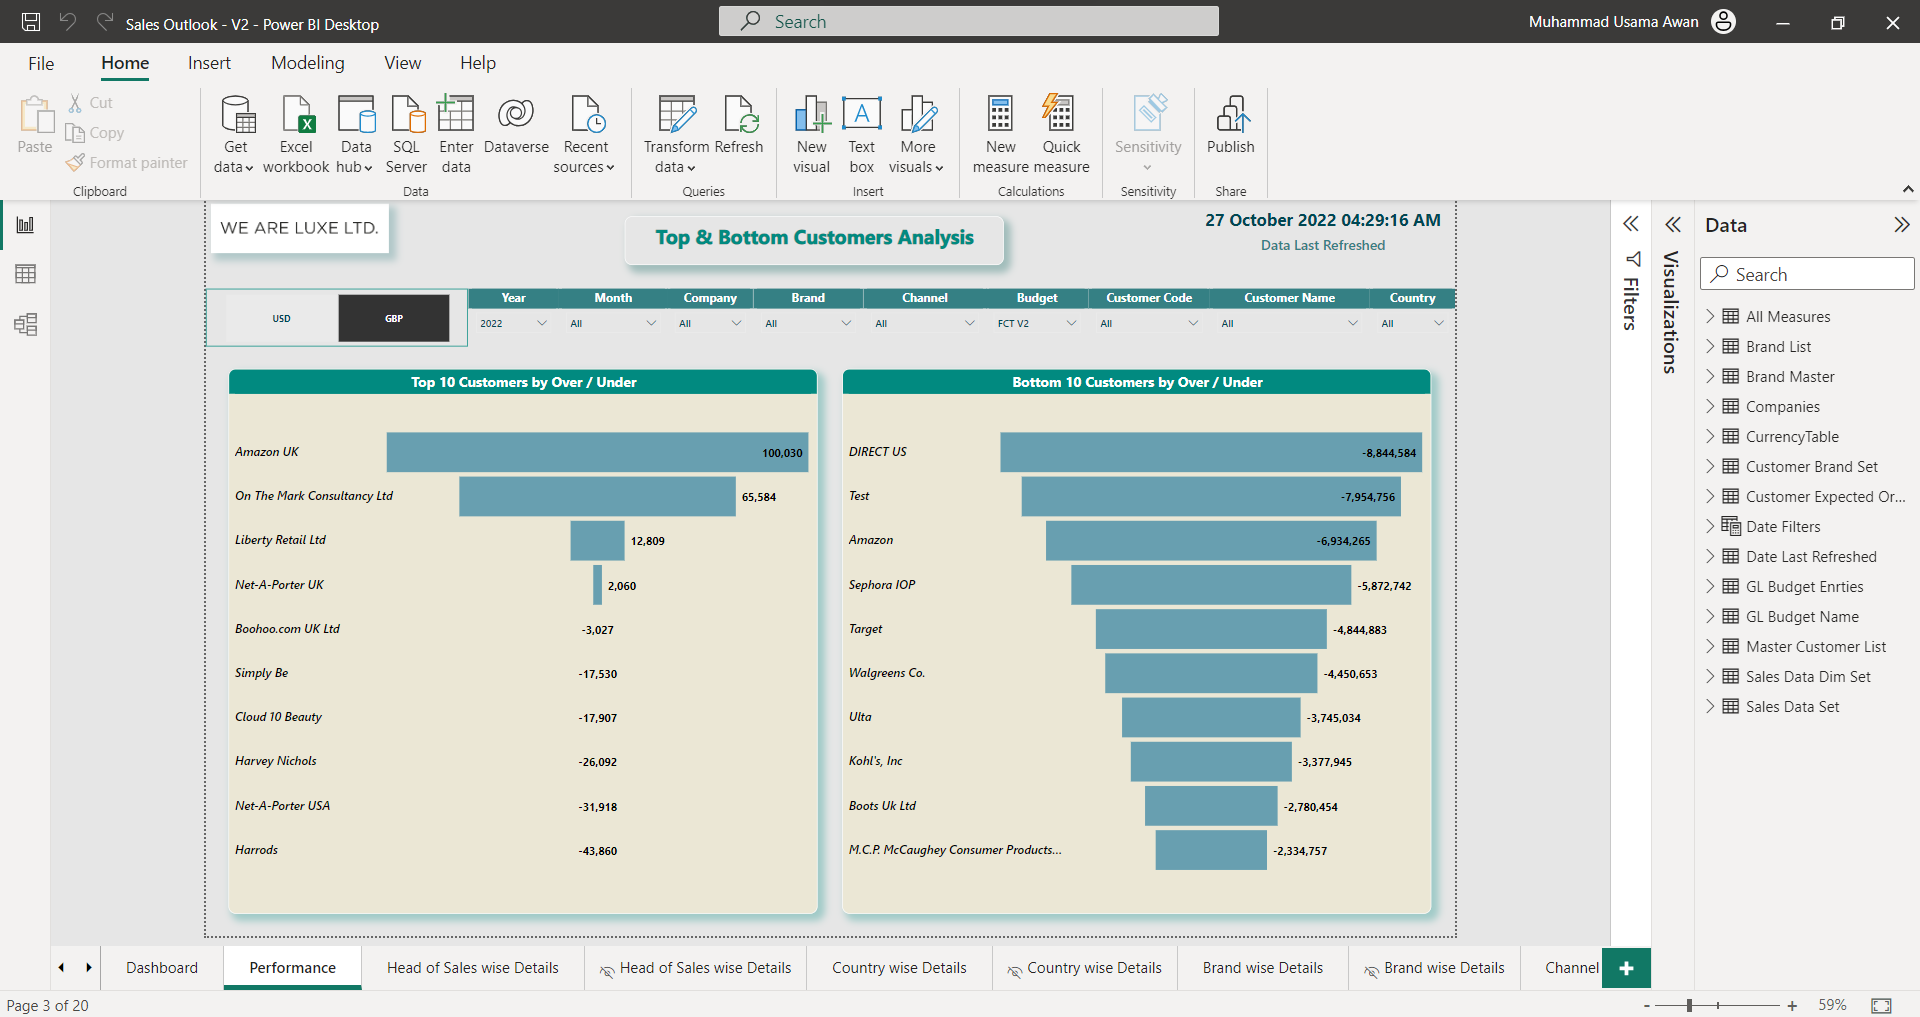
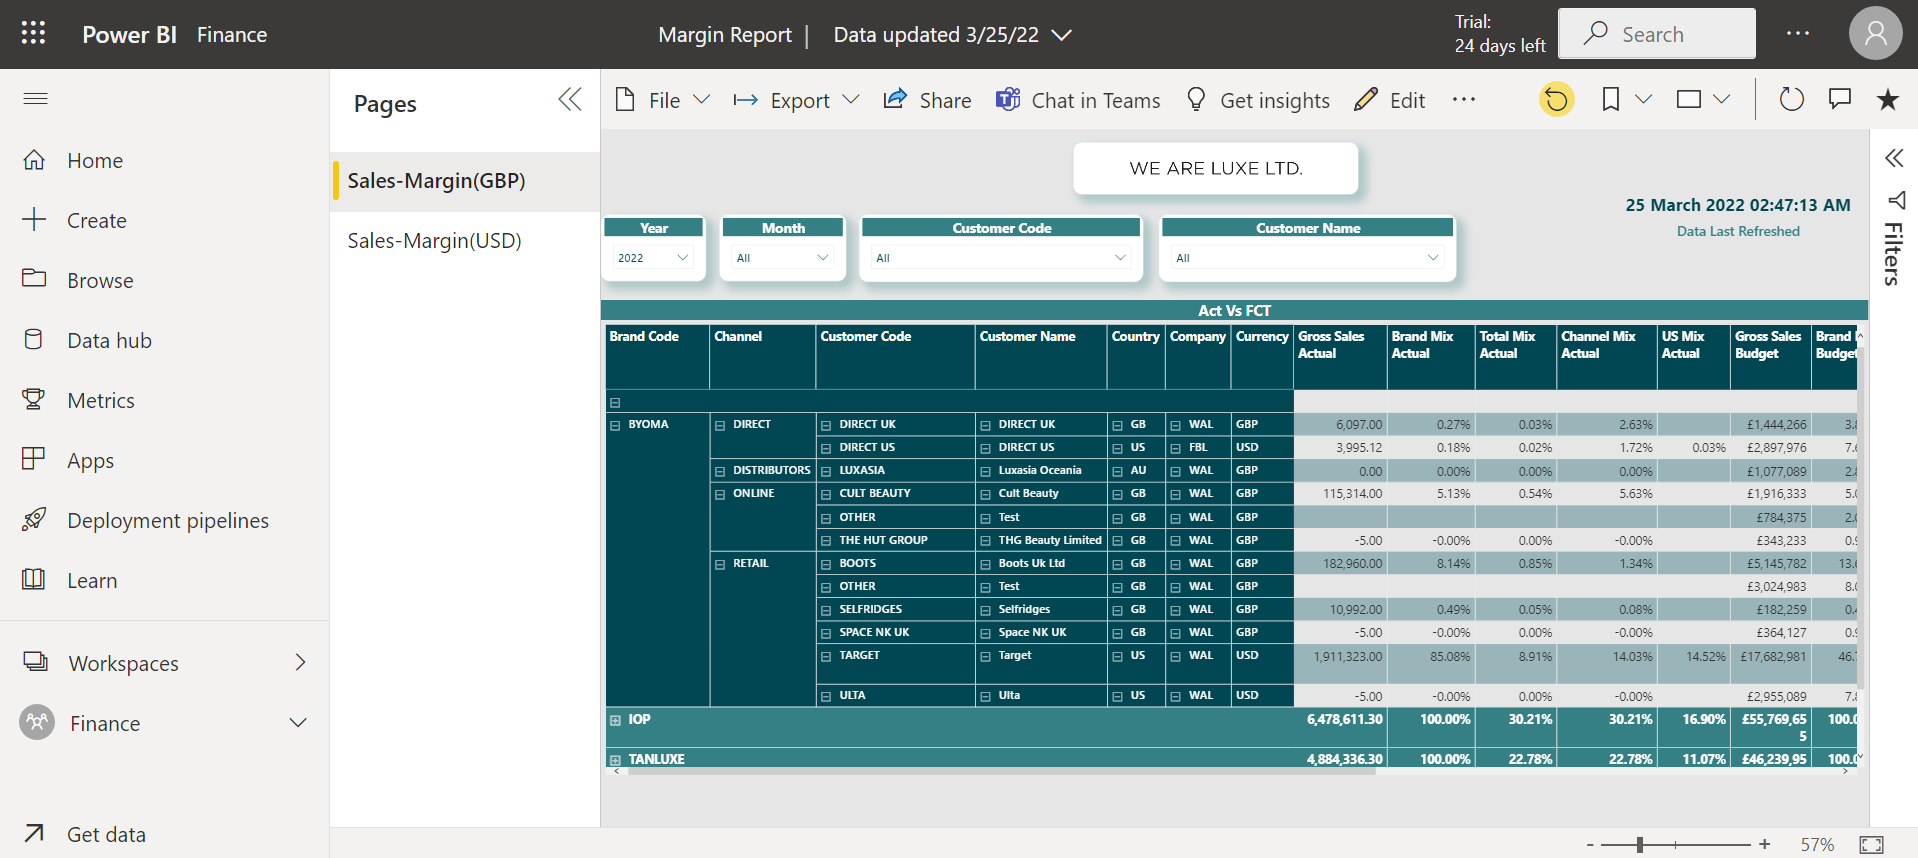
- These reports involved calculations and details of Actuals Vs forecasts, Country-wise, Brand-wise, Channels Wise, Order Wise, Performance wise, and Margin wise.
- Created a dashboard using visualizations and filters. Used Query editor, Filters, Measures, Columns, etc. to transform Calculations in reports.
- Allowed report conversion in USD and GBP.
- Triggered the dataset to refresh data from Datawarehouse daily.
- Made further progress in reports after weekly meetings with clients.